The aim is to build up a detailed knowledge of how waders and wildfowl use the site. this will be a reflection on the condition of the site and will help us tweak management to maximize the effectiveness of the site.
I thought it may be interesting for you to see what we do in regards of monitoring our sites and influencing management.
So, from November until the end of March the volunteers wandered around the sea wall and recorded where the birds were at what time on a map. They also recorded where the birds came in from / went out to if they were disturbed or just natural movements. This not only built up a picture of how many birds were using the site but also how they used the site in terms of time of day, stage of tide or preferred feeding/roosting areas.
There is quite a lot to analyse but I have started to look at the brent geese as these are one of the primary users of the site and a target species. It has turned up some interesting results, not unexpected but nicely explains some of the basic movements that are happening on site
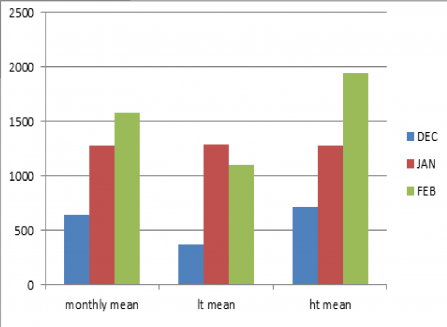
Over the study period there was an increase in the mean number of birds using the site (see graph). This follows an expected change in winter feeding behavior as the primary food source in the harbour, eelgrass (Zoostera spp) reduces through either overgrazing or natural seasonal decline.
There is a steady increase of site usage, peaking in February where the site has a mean number of 1582.86 birds. Historically the number of birds is much higher than this, potentially 4000. 2017/2018 however has been a year with significantly less juveniles in the area following the natural trend associated with breeding success.
The site was used more during high tide than low tide which suggests that the geese were feeding in the harbour. Given the higher mean temperature this winter, this would be expected as the eelgrass stayed in better condition later into the winter.


